How Well Do People Report Time Spent on Facebook? An
Evaluation of Established Survey Questions with
Recommendations
Sindhu Kiranmai Ernala
Georgia Tech
Moira Burke
Facebook
mburke@fb.com
Alex Leavitt
Facebook
alexleavitt@fb.com
Nicole B. Ellison
University of Michigan
ABSTRACT
Many studies examining social media use rely on self-report
survey questions about how much time participants spend on
social media platforms. Because they are challenging to an-
swer accurately and susceptible to various biases, these self-
reported measures are known to contain error – although the
specific contours of this error are not well understood. This
paper compares data from ten self-reported Facebook use sur-
vey measures deployed in 15 countries (N = 49,934) against
data from Facebook’s server logs to describe factors associ-
ated with error in commonly used survey items from the lit-
erature. Self-reports were moderately correlated with actual
Facebook use (r = 0.42 for the best-performing question),
though participants significantly overestimated how much
time they spent on Facebook and underestimated the num-
ber of times they visited. People who spent a lot of time on
the platform were more likely to misreport their time, as were
teens and younger adults, which is notable because of the high
reliance on college-aged samples in many fields. We conclude
with recommendations on the most accurate ways to collect
time-spent data via surveys.
Author Keywords
Self-reports; survey validation; time spent; well-being
CCS Concepts
•Information systems → Social networking sites;
INTRODUCTION
When studying the relationship between technology use and
other aspects of people’s lives, researchers need accurate
ways to measure how much people use those technologies.
Permission to make digital or hard copies of all or part of this work for personal or
classroom use is granted without fee provided that copies are not made or distributed
for profit or commercial advantage and that copies bear this notice and the full citation
on the first page. Copyrights for components of this work owned by others than ACM
must be honored. Abstracting with credit is permitted. To copy otherwise, or republish,
to post on servers or to redistribute to lists, requires prior specific permission and/or a
fee. Request permissions from [email protected].
CHI ’20, April 25–30, 2020, Honolulu, HI, USA.
Copyright is held by the owner/author(s). Publication rights licensed to ACM.
ACM ISBN 978-1-4503-6708-0/20/04 ...$15.00.
http://dx.doi.org/10.1145/3313831.3376435
This measurement remains a key challenge [15, 16]. Histor-
ical advances in data collection—from Nielsen boxes moni-
toring television use [52, 77] to phone sensors [13, 28] and
server logs [12]—have improved these measures, and re-
searchers continue to find innovative ways to combine behav-
ioral data with attitudinal surveys [68]. Still, for a number of
reasons, including the need to compare measures over time,
many scientists employ survey measures of media use.
However, survey participants’ reports of their own media
use have well-documented limitations [42, 20, 30]. Partici-
pants may not report accurately, either because they can’t re-
call or don’t know [59, 63, 57]. They may report in biased
or skewed ways, influenced by social desirability [49], ex-
pressive reporting [7], or priming [69]. Certain demograph-
ics (e.g., young people) may be more prone to recall issues
[56]. The cognitive load of reporting and restrictions on sur-
vey length may preclude obtaining sufficient detail through
surveys [40].
Few of these measures have been validated with comparisons
between self-reports and server-log data, which would assist
researchers in survey item selection. Further, such direct com-
parisons help level the uneven playing field that arises when
scholars who are not affiliated with social media companies
do not have access to server logs and instead rely on (po-
tentially weaker) self-reports. This system also stymies the
research community, in that industry typically focuses on a
different set of questions (e.g., those with more direct con-
nections to product design) than academics who might be
oriented toward basic research [51]. Additionally, industry
researchers may enjoy a methodological advantage because
they are able to access more granular data about what kinds
of activities people do, enabling them to conduct analyses that
those relying on simple survey questions are precluded from
exploring. In some cases, academic researchers are able to
build systems for testing theory that are adopted by enough
users ‘in the wild’ (e.g., MovieLens [27]) but in many cases,
researchers struggle to compete in the marketplace of apps,
or lack the technical or design expertise to pursue this option.
One way to address this challenge would be for platforms to
anonymize and release data to researchers. Although some
companies are exploring ways to share data in a privacy-
preserving way (e.g., [19]), data sharing is challenging for
multiple reasons. Companies are limited by privacy policies
and international laws, and sharing disaggregated user data
without the appropriate notice or consent is problematic eth-
ically (in light of privacy concerns) and logistically (e.g., if
a person deletes a post after that dataset is shared with re-
searchers, it is technically challenging to ensure it is deleted
everywhere). Finally, as was shown through the release of
a crawled dataset, it is very difficult—if not impossible—
to fully anonymize networked social media data [79]. Given
the above, it is important that alternative, validated measures
be made available to researchers who do not have access to
server-level data.
Therefore, this paper presents an evaluation of self-report
measures for time spent on Facebook and recommendations
to researchers. As one of the largest social media platforms,
Facebook is the focus of many empirical studies, most of
which employ some measure of site use. We conducted an
analysis comparing server-logged time-spent metrics to self-
reported time-spent survey questions popular in the field. In
doing so, we note that only measuring time spent on plat-
form may offer limited insight into important outcomes such
as well-being, because how people spend their time is often
more important [11, 8]. However, time on platform is an im-
portant variable in numerous studies [18, 31, 35]. Thus, in or-
der to facilitate meta-analyses and support continuity across
past and future scholarship, this study makes the following
contributions: 1) statistical evaluation of self-reported time
spent measures over a large, international sample, 2) assess-
ment of multiple question wordings, and 3) guidance for re-
searchers who wish to use time-spent self reports.
Four problems motivate this work. First, a wide set of so-
cial media usage questions appear in the published literature.
While there have been investigations of the quality of specific
questions [9, 35], no work to date has provided a compre-
hensive analysis of items evaluated against server-level data.
Second, scholars and policymakers care about outcomes of
social media use including well-being [11, 29], social capi-
tal [17, 18, 80, 12], and academic performance [36, 38, 39].
Accurate assessments of social media use in these domains is
critical because of their importance to people’s lives. Third, as
mentioned above, many scholars do not have access to other
sources of data that could contextualize self-report data, such
as server logs or monitoring software. Measurement valid-
ity remains an important consideration for comparative work
within the scientific community. Finally, comparative interna-
tional understanding of social media use is difficult [45] and
rarely conducted, particularly beyond comparisons of or be-
tween Western countries (cf. [23, 50, 65]). International com-
parative work can be particularly fraught due to measurement
error [54, 67, 2]. Because social media is one of the largest
growing sources of information access globally [55], it is im-
portant to assess the accuracy of these questions in different
regions and cultures in order to support this research.
RELATED WORK
Reliability of Self-Reported Media-Use Measures
The measurement of media use has relied for decades on
self-reports [48, 60]. However, these self-reports have been
shown to be unreliable across many domains. Historically,
self-report validity is low for exposure to television and news-
papers [3, 4, 44, 78], general media use [16, 62], and news
access [70, 43, 32, 73, 56]. Self-reported internet and social
media use have also been found to be unreliable. Many stud-
ies across general internet use [5, 61], device use [37], spe-
cific platforms [47], recall of specific types of content [72],
and specific actions taken [66] find low reliability, especially
when compared to logged behavioral data.
For Facebook in particular, a few studies demonstrate the mis-
match between logged data and retrospective, self-reported
use. Studying 45 U.S. college students, Junco [35] found that
there was a “strong positive correlation” (r = 0.59) but “a sig-
nificant discrepancy” between self-reports and laptop-based
monitoring software: participants reported spending 5.6x as
much time on Facebook (145 minutes per day) as they ac-
tually did (26 minutes). That study did not track Facebook
use on mobile phones and participants may have used it more
or less than usual because they knew they were being tracked.
Haenschen [25] surveyed 828 American adults and found that
“individuals underestimate[d] their frequency of status post-
ing and overestimate[d] their frequency of sharing news links
on Facebook.” Burke and Kraut [9, 11] found that self-reports
of time on site among 1,910 English speakers worldwide were
moderately correlated with server logs (r = 0.45). This paper
builds on this prior work by assessing multiple popular ques-
tion wordings at once with a large, international sample and
provides recommendations to researchers on the best ways to
collect self-reports of time spent on Facebook.
Sources of Error in Self-Reported Time Spent
Mental Models of Time Spent. One of the greatest sources of
ambiguity in self-reports of time spent online is that partici-
pants have different mental models for the phenomenon that
researchers care about. For time spent on Facebook, Junco
[35] found that students in an informal focus group reported
thinking about Facebook “all the time,” which may have
caused them to inflate their self-reported time. Attitudes to-
wards social media use—such as “my friends use Facebook a
lot” or “using social media is bad for me”—might also cause
people to report greater or lesser use, respectively [53]. Some
people may include time reading email and push notifications
from Facebook while others might only count time they ac-
tively scrolled through posts or typed comments. Some may
include the time spent on messaging, depending on whether
they are on a device that incorporates it as a separate applica-
tion or not. For people who do not use Facebook every day,
some may estimate their average use across the past week by
including only days in which they opened the app; others may
include zeros for days of non-use. Beyond these differences,
it may be cognitively impossible for participants to recall time
across multiple devices or interfaces.
Wording and Context. Specific words and context also influ-
ence responses to time-spent questions. Common words may
be interpreted in different ways [21]. For instance, in one
study 53% of respondents interpreted “weekday” as Monday
through Friday (5 days) and 33% as Sunday through Satur-
day (7 days) [6]. Question interpretation varies by gender,
race, and ethnicity [76]. Specific time frames like “in the past
week” or “in general” affect the method people use for esti-
mation [74, 46]. Anchoring bias, or the tendency to rely on
one piece of information while making decisions [1], affects
both question stems (e.g., asking participants about “hours”
or “minutes” per day, where the former may cause people to
assume they spend more than an hour per day and thus report
larger amounts of time) and options in multiple-choice ques-
tions (e.g., setting the highest response choice to “More than
1 hour per day” versus “More than 3 hours per day” influ-
ences people’s perceptions about what “the most” Facebook
use is and where they fit on the response scale).
The present study evaluates several self-report time-spent
questions gathered and adapted from previous social science
research and national surveys, in order to test the error in-
troduced by the features described above and provide recom-
mendations on their use.
METHODS
To understand accuracy in self-reported time spent on Face-
book, a voluntary survey of self-reported time estimates was
paired with actual time spent data retrieved from Facebook’s
server logs in July 2019. All data were analyzed in aggregate
and de-identified after matching.
Participants
Participants (N = 49,934) were recruited via a message at the
top of their Facebook News Feeds on web and mobile inter-
faces. The survey was targeted at random samples of people
on Facebook in the following 15 countries: Australia (N =
630), Brazil (8930), Canada (858), France (2198), Germany
(785), India (4154), Indonesia (2812), Mexico (8898), Philip-
pines (1592), Spain (1780), Thailand (3289), Turkey (2418),
United Kingdom (1425), United States (5682), and Vietnam
(4483). Countries were selected because they had large pop-
ulations or had appeared in prior published literature using
self-reported time estimates. The survey was translated into
the local language of each participant; translated versions of
the survey are available at https://osf.io/c5yu9/
Compared to a random sample of Facebook users, respon-
dents were 1.1 years younger, 5% more likely to be female,
had 55% more friends, spent 115% more time on the site in
the past month, and had 14% fewer sessions in the past month
(all p < 0.001). To account for survey-takers having different
activity levels than a random sample, time-spent data from
a random sample of Facebook users was incorporated where
noted, such as in the denominator when computing z-scores.
How this selection bias affects interpretation of the results is
discussed at the end of the paper.
Survey Content
Participants answered one question from a counterbalanced
set of ten about how much time they spent on Facebook or
how many times they checked Facebook (see Table 1). Ap-
proximately 5000 people answered each question. A super-
set of 32 questions was selected from the literature reviewed
above, and then filtered down to ten based on their popular-
ity (i.e., citation count or use in national surveys) and diver-
sity of phrasing and response choices. Some original ques-
tions were created by the authors, and in some cases, ver-
sions of the same question were presented with different re-
sponse choices. Questions that asked for a specific amount of
time per day used javascript to ensure participants entered a
valid number (no more than 24 hours per day, 1440 minutes
per day, or 100 sessions per day). Participants also answered
questions about perceived accuracy (“You just answered a
question about how much time you spend on Facebook. How
accurate do you think your answer is? Not at all accurate /
Slightly accurate / Somewhat accurate / Very accurate / Ex-
tremely accurate”) and difficulty (“How easy or difficult was
it to answer that question? Very easy / Somewhat easy / Nei-
ther easy nor difficult / Somewhat difficult / Very difficult”).
Server Log Data of Time Spent
Participants’ responses were matched with log data from
Facebook’s servers for the previous 30 days, up to and in-
cluding the day prior to the survey. All data were observa-
tional and de-identified after matching. Time spent was cal-
culated as follows: when a person scrolled, clicked, typed,
or navigated on the Facebook app or website, that timestamp
was logged. When a person switched to a different app or
browser tab or more than 30 seconds passed without a click,
scroll, type, or navigation event, time logging stopped at the
last event. For each of the 30 days, two data points were in-
cluded: daily minutes, the number of minutes they spent in
the foreground of the desktop or mobile versions of Face-
book.com or the Facebook mobile app, and daily sessions,
the number of distinct times they logged in or opened one of
those surfaces, at least 60 seconds after a prior session. Accu-
racy results were qualitatively similar using sessions at least
300 seconds apart. These two variables were aggregated dif-
ferently based on which survey question a person answered,
described below. Daily minutes and sessions did not include
the use of the chat client, Facebook Messenger, which is part
of Facebook.com but is a separate application on mobile de-
vices. We repeated the analyses with and without Messenger
time and determined that including Messenger did not quali-
tatively change results. Participants’ ages, genders, and coun-
tries from their Facebook profiles were included in analyses
where noted.
In order to mirror the typical research practice of inspecting
and cleaning self-report data to account for unrealistic an-
swers, we capped the values of open-ended, objective ques-
tions at the 95th percentile. Most questions had outliers (e.g.,
77 respondents reported using Facebook for 24 hours per
day), and accuracy was lower without this cleaning.
Data for Objective Questions
Hours per day (Question A): Average hours per day for the
seven days prior to the survey. For this and subsequent aver-
ages, any days in which a participant did not open Facebook
Label Question text Responses Response
type
Question
type
Source
A How many hours a day, if any, do you typically spend using
Facebook?
Open text open objective [22]
B In the past week, on average, approximately how many min-
utes PER DAY have you spent actively using Facebook?
Open text open objective [58,
17]
C In the past week, on average, approximately how much time
PER DAY have you spent actively using Facebook?
__ hours __ minutes open objective [17]*
D In the past week, on average, approximately how much time
PER DAY have you spent actively using Facebook?
Less than 10 minutes per day
10–30 minutes per day
31–60 minutes per day
1–2 hours per day
2–3 hours per day
More than 3 hours per day
closed objective [17]
E On average, how many times per day do you check Facebook? Open text open objective [35]
F How many times per day do you visit Facebook, on average? Less than once per day
1-3 times per day
4-8 times per day
9-15 times per day
More than 15 times per day
closed objective [58]
G How much time do you feel you spend on Facebook? Definitely too little
Somewhat too little
About the right amount
Somewhat too much
Definitely too much
closed subjective original
H How much do you usually use Facebook? Not at all
A little
A moderate amount
A lot
A great deal
closed subjective original
I How much do you usually use Facebook? Slider (not at all [0] to a lot [100]) slider subjective [41]*
J How much do you usually use Facebook? Much less than most people
Somewhat less than most people
About the same as most people
Somewhat more than most people
Much more than most people
closed relative original
Table 1. Self-reported time spent questions. Participants answered one of these ten questions. * Question was adapted from the original version.
were listed as 0 and included in the average. Errors are re-
ported in terms of minutes for comparison to other questions.
Minutes per day (B) and Time per day (C): Average min-
utes per day for the seven days prior to the survey.
Daily time past week (D): Average minutes per day for the
seven days prior to the survey. This value was binned to
match survey response choices (e.g., “Less than 10 minutes
per day”).
Times per day (E): Average daily sessions for the 30 days
prior to the survey.
Times per day (F): Average daily sessions for the 30 days
prior to the survey. Session counts were binned to match sur-
vey response choices (e.g., “Less than once per day”).
Data for Subjective Questions
For subjective survey questions, there is no perfect “gold stan-
dard” server-log data, since responses such as “a lot” mean
different things to different people (e.g., based on their com-
parison group). Instead, we attempted to create a reasonable
comparison point, treating the survey responses as a distribu-
tion and seeing how well the participant’s self-reported po-
sition in the distribution matched their position in the actual
time-spent distribution. Our rationale stems from the idea that
a researcher would want people who use Facebook very lit-
tle to respond on the lowest end of their survey instrument
and those who use Facebook a lot to respond on the highest
end. Thus, these server log data are employed to test that idea,
however imperfectly given the limitations of subjectivity.
Feelings about time (G): Total minutes (not daily average)
for the 30 days prior to the survey. Results for this and sub-
sequent questions were qualitatively similar when using daily
average. This value was sliced into five evenly-sized bins to
correspond with the five response choices on the survey.
Usual use (H): Total minutes for the 30 days prior to the sur-
vey. This value was sliced into five evenly-sized bins to cor-
respond with the five response choices on the survey.
Usual use (I): Total minutes for the 30 days prior to the sur-
vey. These data were sliced into 100 evenly-sized bins (their
percentile) to correspond with the slider’s 100 choices.
Usual use compared to others (J): Average daily minutes
for the 30 days prior to the survey capped at the 99th per-
centile to reduce error from outliers, then converted into
the number of standard deviations away from the mean (z-
score). The mean and standard deviations came from a sepa-
rate dataset: a random sample of Facebook users (rather than
survey-takers) to account for survey-takers being more ac-
tive than average. These z-scores were then distributed into
Label Under- Over- Were Were Mean Correlation between Women’s Range of
reported reported accurate close absolute error reported &
actual time
error &
actual time
error & age error
relative
to men’s
error across
countries
A 11% 89% 0% 5% 189.2 minutes 0.29*** 0.11*** -0.17*** 12.1%** 288%***
B 48% 52% 0% 6% 87.5 minutes 0.25*** 0.23*** -0.14*** 9.3%* 200%***
C 14% 86% 0% 4% 255.5 minutes 0.24*** 0.10*** -0.12*** 1.6% 113%***
D 34% 39% 27% 38% 1.2 bins 0.40*** -0.02 -0.04** 2.1% 54%***
E 64% 35% 0% 7% 12.9 sessions 0.27*** 0.23*** -0.17*** -3.8% 134%***
F 49% 18% 34% 39% 1.0 bins 0.42*** -0.01 -0.01 4.2% 44%***
G 35% 42% 24% 40% 1.2 bins 0.24*** -0.05*** 0.01 -2.3% 22%***
H 31% 45% 24% 42% 1.2 bins 0.26*** -0.15*** 0.01 -2.3% 67%***
I 33% 66% 1% 3% 29.2 points 0.24*** -0.26*** 0.02 -1.2% 40%***
J 68% 11% 20% 34% 1.4 bins 0.23*** 0.35*** 0.00 -3.3% 81%***
Table 2. Accuracy metrics for the ten self-report questions. * p < 0.05, **p < 0.01, ***p < 0.001.
five bins to correspond with survey choices: people 0.75 stan-
dard deviations (sd) below the mean (corresponding with us-
ing Facebook “much less than most people”), between 0.75
and 0.25 sd below the mean (“somewhat less than most peo-
ple”), within -0.25 and +0.25 sd of the mean (“about the same
as most people”), between 0.25 and 0.75 sd above the mean
(“somewhat more than most people”) and more than 0.75 sd
above the mean (“much more than most people”).
Evaluating Time Spent Survey Questions
To evaluate self-reported time spent questions, six accuracy
metrics were considered:
1. Correlation between self-reported time spent and actual
time spent, to understand the strength of the relationship
between self-reports and actual time spent.
2. The fraction of participants who under-reported, over-
reported, or correctly reported their use, to understand the
direction of error.
3. The fraction of participants who were close. For open and
slider questions this meant responding within +/-10% of
the correct value. For closed questions this meant selecting
the correct response choice or one choice above or below.
4. The absolute difference between self-reported and actual
time spent, to understand the magnitude of error. For open-
ended questions this value is reported in minutes or ses-
sions per day. For closed and slider questions, this value
is reported in “bins” (how many response choices “off” a
person was from their correct position).
5. Correlation between error (absolute value) and actual time
spent. This indicates whether people who spent a lot of
time on Facebook had more error than people who spent
very little time, or vice-versa. Good questions should have
no statistically significant relationship between error and
actual time spent.
6. How error varied by age, gender, and country, to under-
stand how demographics influence self-report error.
Additionally, to understand more generally what factors con-
tribute to error in self-reports and to assist researchers in char-
acterizing error patterns across samples, two regressions were
run on absolute error (standardized), pooled across multi-
ple questions: one regression for closed-ended questions, and
one for open (error was log-transformed before standardiza-
tion). The covariates were age (standardized), gender (male,
female, and other), country, whether the question was sub-
jective or not (only relevant for the closed questions), the to-
tal amount of time a person spent on Facebook in the past
30 days (log-transformed and standardized), and the total
number of sessions from the past 30 days (log-transformed
and standardized). This explains how demographics, question
characteristics, and Facebook use affect self-report accuracy.
RESULTS
The results section is organized as follows: First is a general
summary of patterns across questions along with a summary
table showing the accuracy metrics per question. Then there
is a more in-depth description of results for specific questions.
Finally, regressions are presented to identify the factors most
strongly associated with sources of error in self-reports.
Summary Across Questions
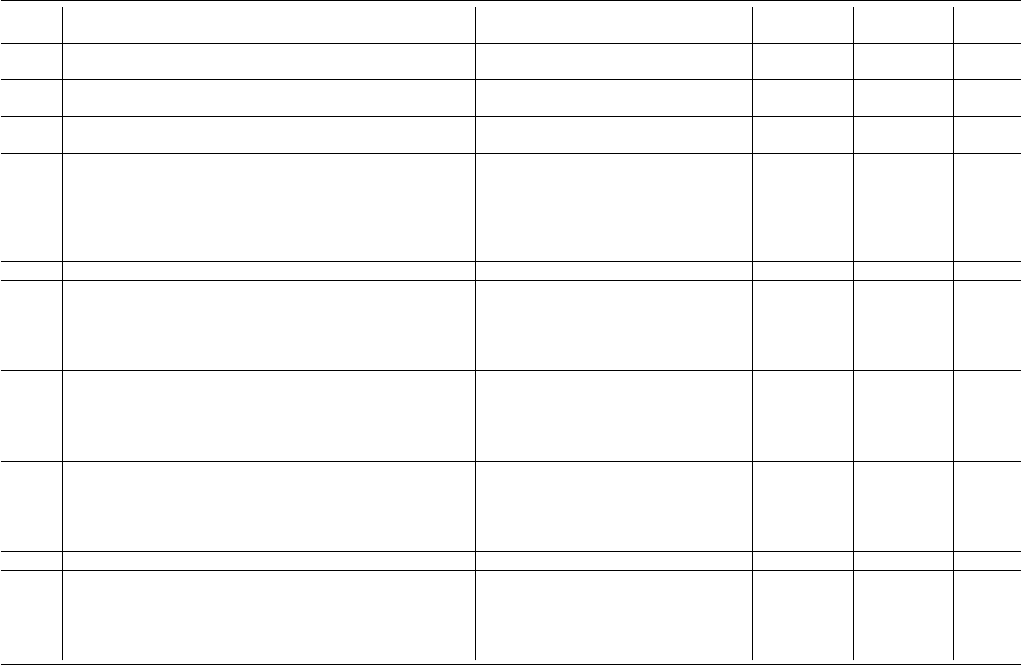
Accuracy. In general, most respondents over-reported how
much time they spent on Facebook and under-reported how
many times they visited. Self-reported measures exhibited
low accuracy with a wide variety of error – systematic over-
reporting, under-reporting, and a noisy mix of both (see Ta-
ble 2 and Figure 1). Correlations between actual and self-
reported Facebook use ranged from 0.23 to 0.42, indicating a
small to medium association between self-reports and server-
logged data [14]. On open-ended questions participants over-
estimated their time spent by 112 minutes per day, though
this value hides substantial variation; on one question partic-
ipants over-estimated by an average of three hours per day.
Closed-ended questions generally had less error than open-
ended questions and participants said that closed-ended ques-
tions were slightly easier to answer (Std. β = 0.09, p < 0.001).
On most questions, there was a relationship between error and
how much time people spent on Facebook: typically, people
who spent more time on the site were less accurate. For sub-
jective questions, the opposite was true: people who spent
very little time on the site were less accurate. Though par-
ticipants believed they were between “somewhat” and “very
accurate” on all questions (M=3.3 out of 5), there was little
relationship between perceived accuracy and error (r = -0.07
across questions). Similarly, participants found most ques-
tions “somewhat” easy to answer (M=2.0 out of 5), but there
was little relationship between difficulty and error (r = 0.03).
0
250
500
750
1000
0 250 500 750 1000
Question A: Hours per day
(reported)
Actual time spent
A
0
200
400
600
0 200 400 600
Question B: Minutes per
day (reported)
B
0
200
400
600
800
0 200 400 600 800
Question C: Time per day
(reported)
C
0
20
40
60
80
0 20 40 60 80
Question E: Times per day
(reported)
E
0
25
50
75
100
0 25 50 75 100
Question I: Usual use
(reported)
I
1
2
3
4
5
6
1 2 3 4 5 6
Question D: Daily time
past week (reported)
Actual time spent
D
1
2
3
4
5
1 2 3 4 5
Question F: Times per day
(reported)
F
1
2
3
4
5
1 2 3 4 5
Question G: Feelings
about time (reported)
G
1
2
3
4
5
1 2 3 4 5
Question H: Usual use
(reported)
H
1
2
3
4
5
1 2 3 4 5
Question J: Usual use compared
to others (reported)
J
Figure 1. Correlation between self-reported and actual time spent, by question. The diagonal line represents perfect accuracy. Points above the line are
underestimates; points below the line are overestimates.
Variation by demographics. On the majority of questions,
teens and young adults had more error than other age groups,
though in most cases the correlation between error and age
was small (max r = -0.17; mean r = -0.06). Pooled across
questions there was no significant difference in error between
women and men (p = 0.24), though women and men differed
in error on specific questions (Table 2). Countries exhibited
different levels of error (Kruskal-Wallis chi-square = 87.0, p
< 0.001); Global South countries had more error than Western
countries. The countries with the most absolute error, Thai-
land and the Philippines, had roughly twice the error as coun-
tries with the least error (France, Australia, and the UK).
Analysis of specific questions
We selected three questions to describe in more depth based
on their adoption history and the insights they provided re-
garding error patterns. Accuracy statistics for all questions
appear in Table 2.
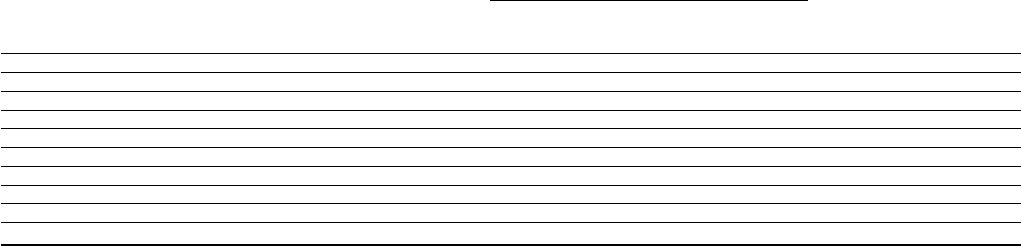
Question D: In the past week, on average, approximately
how much time PER DAY have you spent actively using
Facebook? <multiple-choice>
This question exhibited one of the highest accuracies in terms
of correlation between actual and reported time (r = 0.40).
The percentage of participants who selected the correct re-
sponse choice was relatively high (27%), and the mean abso-
lute error was typical for a closed question: on average, par-
ticipants were 1.2 bins away from the correct one (e.g., if the
correct answer was “31 to 60 minutes per day” the average
participant chose one of the adjacent choices: “10-30 minutes
per day” or “1-2 hours per day”). Moreover, this was one of
only two questions with the desirable property of having no
statistically significant relationship between error and actual
time-spent. Roughly equal percentages of respondents under-
reported (34%) and over-reported (39%). Participants found
the question easy to answer (M=1.9, corresponding to “some-
what easy”). They thought that they were “somewhat accu-
rate” (M=3.33), though there was little relationship between
0%
10%
20%
30%
<10
min
10-30
min
31-60
min
1-2
hr
2-3
hr
>3
hr
Percent of respondents
Source of time-spent data
Server logs Survey self-reports
(a)
0%
10%
20%
30%
<10
min
10-30
min
31-60
min
1-2
hr
2-3
hr
>3
hr
Percent of respondents
Source of time-spent data
Server logs Survey self-reports
(a)
1.0
1.1
1.2
1.3
1.4
1.5
13-17
18-22
23-30
31-40
41-50
51-64
65+
(b)
Age
Absolute error
0.8
1.0
1.2
1.4
1.6
Indonesia
Philippines
Thailand
Turkey
Mexico
Brazil
Vietnam
India
Canada
France
Germany
United States
Great Britain
Australia
Spain
(c)
Country
1.175
1.200
1.225
1.250
1.275
Female
Male
(d)
Gender
1.0
1.2
1.4
1.6
<10 min
10-30 min
31-60 min
1-2 hr
2-3 hr
>3 hr
(e)
Actual use
Figure 2. Analysis of Question D. (a) Distribution of self-reported and
actual time spent. (b-e) Variation in self-report error by age, country,
gender, and actual Facebook use.
perceived and actual accuracy (r = 0.06). Despite performing
best, this question still led to two-thirds (73%) of respondents
choosing wrong. Figure 2a compares respondents’ answers to
self-reports, suggesting that one source of error was that 20%
of respondents thought they spent more than three hours per
day (the maximum bucket), when only 6% actually did.
Figures 2b-e show how error varied with demographics and
Facebook use. Like most questions, on this question teens and
young adults had slightly more error than other age groups (r
= -0.04, p < 0.001). Men and women were not statistically sig-
nificantly different in error. Countries differed in error, though
Actual hours
Self-reported hours
0.0
0.1
0.2
0.3
0.4
0.5
0 1 2 3 4 5 6 7 8 9 10 11 12 13
Hours per day
Density
(a)
Actual hours
Self-reported hours
0.0
0.1
0.2
0.3
0.4
0.5
0 1 2 3 4 5 6 7 8 9 10 11 12 13
Hours per day
Density
(a)
100
150
200
250
300
13-17
18-22
23-30
31-40
41-50
51-64
65+
(b)
Age
Absolute error
100
200
300
400
Thailand
Philippines
Vietnam
Indonesia
Brazil
Mexico
India
Turkey
Canada
Australia
France
United States
Spain
Great Britain
Germany
(c)
Country
170
180
190
200
210
Female
Male
(d)
Gender
100
200
300
0
50
100
150
(e)
Actual use
Figure 3. Analysis of Question A. (a) Distribution of self-reported and
actual time spent. (b-e) Variation in self-report error by age, country,
gender, and actual Facebook use.
the differences were smaller than in other questions, with
a difference of 0.54 bins between Spain and Indonesia, the
countries with the least and most error on this question. Par-
ticipants who used Facebook the least (according to server
logs) had the greatest absolute error on this question, roughly
16% more than other groups (p=0.03).
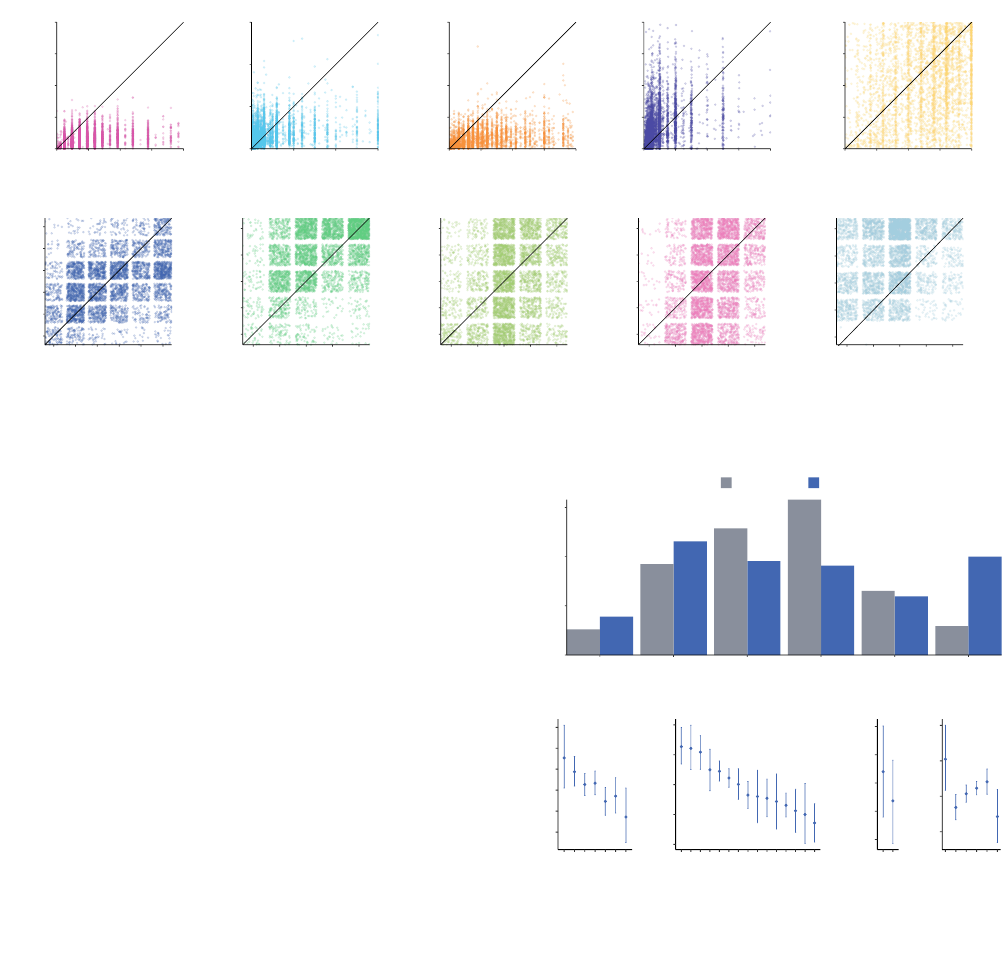
Question A: How many hours a day, if any, do you typi-
cally spend using Facebook? (open ended) This question had
mixed accuracy compared to other questions, with very high
absolute error (M=3.2 hours). Participants reported spend-
ing an average of 4 hours on Facebook; in reality, they only
spent 1.3 hours. Only 5% of respondents were close (reported
within +/- 10% of the actual time). Figure 3a shows the dis-
crepancy between reported and actual time spent. Further-
more, 89% of respondents over-reported. Despite the high
magnitude of error, the pattern of responses was moderately
correlated with actual time spent (r = 0.29), the highest cor-
relation among the open-ended questions, though lower than
the best-performing closed questions. One reason why this
question performed poorly could be related to anchoring bias:
asking people to think about “hours” may cause them to as-
sume they spend more than an hour a day, and thus respond
with higher values [1]. For comparison, the open-ended ques-
tion about “minutes per day” (Question B) had about half as
much error (M=87 minutes error vs. M = 189), and the ques-
tion with open-ended options to enter both hours and minutes
(Question C) had the greatest absolute error (M=256 minutes
error), indicating that “hours” is a poor unit for self-reported
social media use compared to “minutes.”
As in most other questions, error decreased with age (r =
−0.17, Figure 3b). There was substantial variation in error
across countries (Figure 3c), with Thailand having an average
0%
10%
20%
30%
40%
<1 time 1-3 times 4-8 times 9-15 times >15 times
Times per day
Percent of respondents
Source of time-spent data
Server logs Survey self-reports
(a)
0%
10%
20%
30%
40%
<1 time 1-3 times 4-8 times 9-15 times >15 times
Times per day
Percent of respondents
Source of time-spent data
Server logs Survey self-reports
(a)
0.8
0.9
1.0
1.1
1.2
13-17
18-22
23-30
31-40
41-50
51-64
65+
(b)
Age
Absolute error
0.8
1.0
1.2
1.4
Australia
India
United States
Great Britain
Mexico
Philippines
Vietnam
Canada
Germany
Indonesia
Brazil
Turkey
France
Thailand
Spain
(c)
Country
0.94
0.96
0.98
1.00
1.02
1.04
1.06
Female
Male
(d)
Gender
0.9
1.2
1.5
1.8
<1 time
1-3 times
4-8 times
9-15 times
>15 times
(e)
Actual use
Figure 4. Analysis of Question F. (a) Distribution of self-reported and
actual time spent. (b-e) Variation in self-report error by age, country,
gender, and actual Facebook use.
of four hours more error than Germany. Women had more er-
ror than men (12%, p < 0.01, Figure 3d). People who spent
more time on Facebook had more error in their self-reports (r
= 0.14, p < 0.001, Figure 3e).
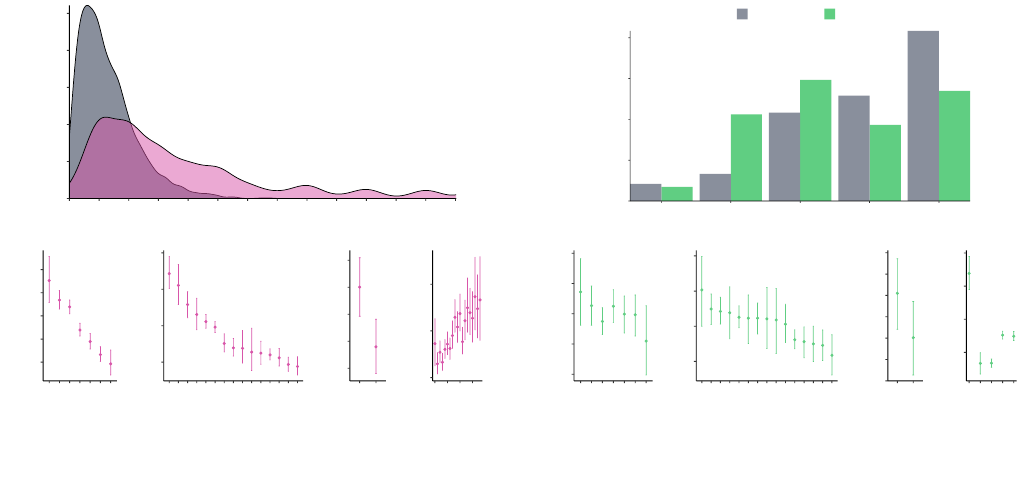
Question F: How many times per day do you visit Face-
book, on average? Unlike the previous questions, this ques-
tion focused on sessions rather than time. And in contrast to
reports of time, a majority of participants under-reported their
number of sessions. This question had the highest correlation
between self-reported and actual sessions (r = 0.42); about
half (49%) of participants under-reported their sessions, 18%
over-reported, and 34% responded accurately. Roughly one-
third (39%) “got close” (got within one bin of the correct
choice; mean absolute error = 1.0 bins). Although the cor-
relation between self-reported and actual use on this question
is about the same as Question D, the data reveal opposite pat-
terns – participants over-reported when asked about time (in
hours/minutes) but under-reported when asked about visits.
Prior work observed similar over-reporting patterns when par-
ticipants were asked to report time spent in contrast to logins
[35]. Figure 4a shows one potential source of error: accord-
ing to the server logs, 42% of participants had more than 15
sessions per day (M = 16.2 sessions per day). Changing the
response choices to accommodate larger numbers may reduce
error in this question.
Unlike the previously-discussed questions, teens and young
adults exhibited the same amount of error as older ages (p
= 0.65, Figure 4b). For comparison, the open-ended question
about sessions exhibited the most error among younger re-
spondents (r = -.17, p < 0.001), further indicating that closed-
questions performed better than open-ended ones. There was
substantial variation in error across countries (Fig 4c), though

Model A: Open & Slider Qs. Model B: Closed Qs.
covariate estimate SE estimate SE
Intercept −0.04 0.02 −0.02 0.02
Actual time 0.05∗ ∗∗ 0.01 0.00 0.01
Actual sessions 0.10∗ ∗∗ 0.01 −0.03∗ ∗∗ 0.01
Age −0.07∗ ∗∗ 0.01 −0.00 0.01
Gender:Male −0.03∗ 0.01 −0.00 0.01
Gender:Other 0.06 0.11 0.12 0.11
Subjective Q. NA NA −0.02 0.01
Australia −0.05 0.06 −0.03 0.06
Brazil 0.06∗ 0.02 −0.01 0.02
Canada −0.04 0.05 0.01 0.05
Germany −0.07 0.05 0.02 0.05
Spain −0.05 0.04 −0.09∗ 0.04
France −0.09∗ 0.04 −0.00 0.03
UK −0.07 0.04 0.01 0.04
Indonesia 0.07 0.03 0.11∗ ∗∗ 0.03
India 0.03 0.03 0.02 0.03
Mexico 0.10∗ ∗∗ 0.03 0.07∗ ∗∗ 0.02
Philippines 0.20∗ ∗∗ 0.04 0.08∗ 0.04
Thailand 0.23∗ ∗∗ 0.03 0.04 0.03
Turkey 0.05 0.04 0.00 0.03
Vietnam 0.08∗ 0.03 0.11∗ ∗∗ 0.03
R
2
= 0.04 R
2
= 0.002
Table 3. Factors associated with error in self-reports. Note: reference
level for categorical covariates is United States (US) for country and Fe-
male (F) for gender.
the order of countries is different from previous questions.
Here, rather than Western countries uniformly exhibiting less
error, Western and non-Western countries are mixed, in part
because the range of error across countries was somewhat
smaller, at 44%. People who visited Facebook less than once
a day (averaged across a month) had the most difficulty an-
swering this question; they had 58% more absolute error in
their self-reports (p < 0.001, Fig 4e). Perhaps one reason
for error among infrequent visitors was that when consid-
ering their “average,” they may have only counted days on
which they did visit Facebook—their denominator may have
been smaller than that of frequent visitors—thereby produc-
ing higher estimates.
Factors associated with error in self-reported time spent
Table 3 shows the results of two regressions pooled across
multiple questions: Model A illustrates error in open-ended
and slider questions, and Model B shows closed-ended ques-
tions. In open-ended questions, many demographic and be-
havioral factors were associated with differences in error:
people who used Facebook more (in both time and sessions)
had more error in self-reports, younger people had more er-
ror, and women had more error than men. In general, Global
South countries had more error.
However, closed-ended questions reduced some of this dis-
parity in error. While people who had a lot of sessions had
less error, people who spent a lot of time on Facebook had
no additional error. There was no difference in error between
younger and older people, and no difference between women
and men. There were still between-country differences in er-
ror, with non-Western countries having higher levels of error.
DISCUSSION
In this paper, we shared an empirical validation of survey
measures for self-reporting time spent on Facebook in or-
der to offer guidance for future use and a lens for interpret-
ing previously published research. We found that self-report
measures had substantial error associated with question and
participant characteristics, including how much time they ac-
tually spent on Facebook. In this section we discuss sources
of error and provide recommendations for best practices for
measuring time-spent on Facebook in the future.
Error Related to Actual Time Spent. On all but one of the
questions, there was a statistically significant correlation be-
tween error and actual time spent, meaning that the concept
being measured in a self-report was not independent of its
error. This non-independence makes it challenging for re-
searchers to rely on most self-report questions. Two questions
(D and F) performed better than others in this regard, one of
which we recommend below. For most questions, people who
spent more time on Facebook had more difficulty reporting
accurately, perhaps because larger numbers are harder to re-
call or because quotidian activities are less memorable. This
connection between error and actual time spent persisted af-
ter accounting for age, gender, and country (Table 3), and it
was only somewhat improved by using closed-ended ques-
tions rather than open-ended ones. Conversely, some of the
subjective questions showed the opposite pattern: people who
spent very little time on Facebook had more error, perhaps be-
cause rare events are also more difficult to recall [64].
Perceived Accuracy and Difficulty. On average, people over-
estimated the accuracy of their answers to self-report time-
spent questions and found the self-reported time question rel-
atively easy to answer. But very few respondents were ac-
tually accurate, and there was no statistical relationship be-
tween their perceived and actual accuracy. This combination
presents an additional challenge to researchers: if participants
think a question is easy to answer and believe their answers
are correct, they may not expend much effort to produce an
accurate self-report, and indeed may not be able to, even with
more effort. Furthermore, researchers themselves may be sub-
ject to the same misperceptions, placing too much trust in the
perceived accuracy of a self-report.
Open-Ended vs. Closed Questions. In this study, closed ques-
tions generally had less error than open-ended ones. Even on
the most accurate open-ended question (Question A), 89%
reported more time than they actually spent, and only 6% of
respondents were close, answering within a +/-10% margin of
error. Demographic and behavioral factors were strongly as-
sociated with different error levels on open-ended questions
(e.g., younger people and women had more error on open-
ended questions, as did people who spent a lot of time and
had a lot of sessions), but on closed questions the differences
in error related to most of these factors was smaller or disap-
peared completely. Participants reported that closed questions
were easier to answer. However, Junco [35] notes the limita-
tions inherent in closed questions, that “Facebook frequency
of use questions with categorical choices may reflect the re-
searcher’s a priori biased estimate of the distribution of time
spent on the site. Furthermore, categorical choices may artifi-
cially truncate variance in ways that reduce measurement pre-
cision. Providing such a non-specific range makes it difficult
to evaluate against other studies and poses problems of accu-
racy when conducting multivariate statistical models.” How-
ever, given the elevated error in open-ended questions and its
relationship to demographics and platform use, as well as the
increased cognitive difficulty in answering them, we advise
closed questions despite these limitations, especially when re-
searchers follow the recommendations below.
Visits vs. Time Spent Questions. In general, participants over-
reported how much time they spent on Facebook and under-
reported how many times they visited Facebook. Prior work
also noted a discrepancy between self-reported time and visits
on Facebook: Junco [35] found that self-reported logins were
less accurate than self-reported time spent, that the two self-
report measures were differentially related to academic out-
comes, and perhaps measure two independent concepts [33,
34, 36]. Although we found both time spent and visits have
similar accuracy on the best-performing questions (Questions
D and F), on most questions, error among younger people was
higher than among older adults. However, on the multiple-
choice “visits” question (Question F), error was unrelated to
age and thus may be a good choice when researchers plan to
survey both young people and older adults in the same study
and want to reduce self-report error related to age.
Demographics. For the majority of the questions we tested,
answers from teens and young adults (participants aged 13 -
22) had more error compared to other age groups. This is im-
portant to note, as most research focusing on Facebook use
and well-being and other important outcomes is conducted
with college student samples (e.g., [12, 35, 40]). We rec-
ommend that when possible, researchers expand participant
pools beyond convenience samples of undergraduates, whose
self-reports may be more error-prone. For studies of academic
performance and other outcomes in which young adults are
the focus, researchers may want to avoid self-reports and in-
stead use automated tools as described below to reduce po-
tential sources of error.
International Comparisons. Questions showed substantial
variation in error rates by country. One pattern emerged: self-
reports of time spent from Western countries (United States,
Europe, UK, and Australia) were more accurate than reports
from Global South countries. As one possible cause, Gil de
Zuniga et al. [23] suggests that international differences in
individual personality may impact social media use patterns,
and these patterns could then impact self-assessment. Second,
researchers at Pew [55] find that respondents in the Global
South are younger, which is consistent with our data, and
since self-report errors are higher among younger respon-
dents, age may be a contributing factor. Finally, all of the
self-report questions in the present study were developed in
Western countries, where people may have different network
connectivity patterns, devices, and mental models for what
constitutes “time spent” on Facebook. Social media contin-
ues to grow in developing countries [55], and more research
in Global South communities needs to be conducted to un-
cover why these trends occur.
Recommendations
Informed by these results, we recommend the following to
researchers aiming to measure time spent on Facebook:
1. Researchers should consider asking participants to use
time tracking applications as an alternative to self-report
time-spent measures. Tools such as “Your Time on Face-
book” display a person’s weekly Facebook time on that
device, and researchers can ask participants to report that
value. Similarly, “Apple Screen Time” and “Android Digi-
tal Wellbeing” track smartphone use, and productivity ap-
plications (such as “Moment”) break down phone use by
application. Researchers have already begun using this ap-
proach: Hunt et al. [29] had participants share screenshots
of iOS battery logs, and Junco [35] used laptop monitoring
software, as did Wang and Mark [75]. Other researchers
have similarly recommended these methodological choices
(e.g., [16, 24]). These tools have their own limitations and
may not be appropriate for some studies. For instance, they
may not capture time spent on other devices, may not be
available in all countries, or may be cumbersome to use.
2. When time-spent must be collected via self-report, we rec-
ommend the following wording from [17], which had the
lowest error in this study. As noted below, researchers may
need to adjust the response set for use with different sub-
populations and as Facebook changes over time.
In the past week, on average, approximately how much time
PER DAY have you spent actively using Facebook?
Less than 10 minutes per day
10–30 minutes per day
31–60 minutes per day
1–2 hours per day
2–3 hours per day
More than 3 hours per day
3. We recommend multiple-choice rather than open-ended
questions because they had lower error overall and less
error related to demographic and behavioral differences.
One general challenge of closed-ended responses is that
these responses need to be generated by researchers, who
in some cases may not know the “best” response set. Re-
searchers may need to conduct qualitative research, use
time-tracking applications, or conduct pilot studies in or-
der to identify appropriate response sets.
4. Because time-spent self-reports (minutes or hours) are im-
precise, we caution researchers against using the values di-
rectly (e.g., for prescribing the “right amount of use” to
optimize academic performance), but rather interpret peo-
ple’s self-reported time as a noisy estimate for where they
fall on a distribution relative to other respondents.
Researchers should also consider these broader points:
First, the strongest survey measures will likely evolve over
time, as technologies and social practices shift. That said,
employing a stable set of established measures is an impor-
tant methodological practice that enables meta-analysis and
synthesis across studies conducted at different times or with
different populations. This tension reflects one grand chal-
lenge of the field: how to reconcile the need to use established
measures with the fact that social media platforms iterate of-
ten, adding and removing features, and social practices shift
over time. New cultural practices, innovations in hardware,
and changing levels of access have important implications
for people’s everyday experiences and research instruments
should enable them to be accurately expressed. Yet our larger
research practices and dissemination norms remain far less
nimble. For instance, research papers take years to be pub-
lished and citation counts direct attention to papers published
decades ago and away from potentially more innovative new-
comers. As a result, social media use measures become en-
trenched far after they reflect contemporary practices or rel-
evant featuresets. For instance, the Facebook Intensity Scale
[17] was originally created to study a specific population (un-
dergraduates at a U.S. institution) at a particular moment in
time (e.g., prior to the launch of News Feed). However, since
its development, researchers have used this measure in very
different contexts without an established process for updat-
ing its phrasing or response choices. While these challenges
are beyond the scope of this paper, we hope to contribute
positively by providing some validated measures that can be
used across studies while acknowledging the need for con-
sistent measurement across studies and emphasizing the fact
that these measures should be seen as plastic, not immutable.
Second, while our focus here is time spent questions—
because these are very common in the literature—we ac-
knowledge that merely examining the amount of time an indi-
vidual uses social media is inadequate for almost any question
of interest to social scientists (e.g., well-being outcomes). The
fact that what people do with a particular medium is a more
powerful predictor than just how much time they spend do-
ing it is not a new finding: Bessière and colleagues [8] docu-
mented this over a decade ago, and it is true for social media
as well [10, 11, 18, 71]. A recent meta-analysis of 226 papers
on social media use and well-being [26] revealed that time
on Facebook alone was not a significant predictor of overall
well-being although network characteristics were.
Finally, it is vital to support international development of
social media research. Comparative work is rare, particu-
larly beyond two or three countries. But comparative work
also suffers from additional cross-cultural measurement er-
ror [54, 2, 67]. We felt it was important to test survey items
in multiple countries in order to provide some insight into
how response patterns differ across regions, allowing for
more synthesis across datasets and studies. As we demon-
strate above, for time spent, self-report responses drawn from
Global South communities may contain higher error rates. We
hope that the provided translations for recommended survey
items may stimulate standardized research that allows com-
parison across multiple countries.
Limitations and Future Work
There are a number of limitations that need to be considered
for this work. First, respondents opted-in to the survey while
using Facebook, which meant that participants tended to be
more active than average users. We account for this where
possible, such as in the regressions to understand how error
relates to factors such as actual time spent, and when stan-
dardizing responses to Question J, in which people report
how they use Facebook relative to “most people.” However,
the selection bias among survey participants remains a limita-
tion of this work, as it is in other survey research that recruits
participants from active online pools.
Second, server logging can be technically complex. Because
people may use different devices throughout a day, aggregat-
ing at the user level is complicated and may miss use oc-
curring on other people’s phones (e.g., borrowing) or when
people jump between multiple devices connected at the same
time. Operating system and device-specific differences may
slightly impact time and session logging as well. Thus, some
of the discrepancies between self-reports and server-log data
may be the result of logging, though this is likely small in
proportion to errors due to human recall.
Third, time and other constraints precluded us from assessing
every possible survey question permutation (e.g., the same
stem with different sets of multiple-choice response options,
a wider variety of reference periods), so questions that elicit
more accurate use estimates likely exist. Also, understand-
ing people’s cognitive processes around how they report time
spent is important. We hope this will be the beginning of a
larger conversation about measure refinement and context of
use in a rapidly shifting research field. The wording we rec-
ommend in this paper is not intended to be cast in stone, but
rather a starting point based on current data. We encourage –
and in fact, it is necessary that – researchers with the ability to
compare server and self-report data do so and share their find-
ings, and for researchers to continue to triangulate and refine
usage measures as well as pursue more holistic understand-
ings of how people perceive their social media use.
CONCLUSION
This work illustrates common sources of error in self-reported
measures of Facebook use to provide guidance for future
work and context for evaluating past scholarship. Young
adults and respondents in the Global South had higher av-
erage levels of error, as did people who spent more time on
Facebook. We recommend using logging applications rather
than self-reports where feasible and appropriate, treating self-
reports as noisy estimates rather than precise values, and
we identify the currently best-performing self-report ques-
tion. Further work is needed to capture international differ-
ences and assess behaviors that are likely to be more impor-
tant than simple measures of time spent on the platform. As
with all measures, researchers should triangulate data with
other methods such as interviews to reduce bias and enable
researchers to remain sensitive to user experiences and per-
ceptions. Considering time-spent in conjunction with other
metrics, such as information about what people are doing,
their network, or how they feel about their experiences, will
be increasingly critical for understanding the implications of
social media use on outcomes such as well-being.
ACKNOWLEDGEMENTS
We’d like to thank Andrew Fiore, Rebecca Gray, Eden Litt
and Brian Waismeyer for their contributions to this project.
REFERENCES
[1] Adrian Furnham and Hua Chu Boo. 2011. A Literature
Review of the Anchoring Effect. The Journal of
Socio-Economics 40, 1 (2011), 35–42.
https://www.sciencedirect.com/science/article/abs/
pii/S1053535710001411
[2] Alexander Szalai, Riccardo Petrella, and Stein Rokkan.
1977. Cross-National Comparative Survey Research:
Theory and Practice. Pergamon.
[3] Richard L. Allen. 1981. The Reliability and Stability of
Television Exposure. Communication Research 8, 2
(April 1981), 233–256. DOI:
http://dx.doi.org/10.1177/009365028100800205
[4] Richard L. Allen and Benjamin F. Taylor. 1985. Media
Public Affairs Exposure: Issues and Alternative
Strategies. Communication Monographs 52, 2 (June
1985), 186–201. DOI:
http://dx.doi.org/10.1080/03637758509376104
[5] Theo Araujo, Anke Wonneberger, Peter Neijens, and
Claes de Vreese. 2017. How Much Time Do You Spend
Online? Understanding and Improving the Accuracy of
Self-Reported Measures of Internet Use.
Communication Methods and Measures 11, 3 (July
2017), 173–190. DOI:
http://dx.doi.org/10.1080/19312458.2017.1317337
[6] W.A. Belson. 1981. The Design and Understanding of
Survey Questions. Lexington Books.
[7] Adam J. Berinsky. 2018. Telling the Truth About
Believing the Lies? Evidence For the Limited
Prevalence of Expressive Survey Responding. The
Journal of Politics 80, 1 (Jan. 2018), 211–224. DOI:
http://dx.doi.org/10.1086/694258
[8] Katherine Bessière, Sara Kiesler, Robert Kraut, and
Bonka S. Boneva. 2008. Effects of Internet Use and
Social Resources on Changes in Depression.
Information, Communication & Society 11, 1 (Feb.
2008), 47–70. DOI:
http://dx.doi.org/10.1080/13691180701858851
[9] Moira Burke and Robert Kraut. 2016a. Online or
Offline: Connecting With Close Friends Improves
Well-being. (2016). https:
//research.fb.com/blog/2016/01/online-or-offline-
connecting-with-close-friends-improves-well-being/
[10] Moira Burke, Robert Kraut, and Cameron Marlow.
2011. Social capital on Facebook: Differentiating Uses
and Users. In Proceedings of the SIGCHI conference on
human factors in computing systems. ACM, 571–580.
[11] Moira Burke and Robert E Kraut. 2016b. The
Relationship Between Facebook Use and Well-being
Depends on Communication Type and Tie Strength.
Journal of computer-mediated communication 21, 4
(2016), 265–281.
[12] Moira Burke, Cameron Marlow, and Thomas Lento.
2010. Social Network Activity and Social Well-being.
In Proceedings of the 28th international conference on
Human factors in computing systems - CHI ’10. ACM
Press, Atlanta, Georgia, USA, 1909. DOI:
http://dx.doi.org/10.1145/1753326.1753613
[13] Carlos A. Celis-Morales, Francisco Perez-Bravo, Luis
Ibañez, Carlos Salas, Mark E. S. Bailey, and Jason
M. R. Gill. 2012. Objective vs. Self-Reported Physical
Activity and Sedentary Time: Effects of Measurement
Method on Relationships with Risk Biomarkers. PLoS
ONE 7, 5 (May 2012), e36345. DOI:
http://dx.doi.org/10.1371/journal.pone.0036345
[14] Jacob Cohen. 1988. Statistical power analysis for the
behavioral sciences (2nd ed ed.). L. Erlbaum
Associates, Hillsdale, N.J.
[15] Claes H. de Vreese and Peter Neijens. 2016. Measuring
Media Exposure in a Changing Communications
Environment. Communication Methods and Measures
10, 2-3 (April 2016), 69–80. DOI:
http://dx.doi.org/10.1080/19312458.2016.1150441
[16] David A Ellis, Brittany I Davidson, Heather Shaw, and
Kristoffer Geyer. 2019. Do Smartphone Usage Scales
Predict Behavior? International Journal of
Human-Computer Studies 130 (2019), 86–92.
[17] Nicole B. Ellison, Charles Steinfield, and Cliff Lampe.
2007. The Benefits of Facebook “Friends:” Social
Capital and College Students’ Use of Online Social
Network Sites. Journal of Computer-Mediated
Communication 12, 4 (July 2007), 1143–1168. DOI:
http://dx.doi.org/10.1111/j.1083-6101.2007.00367.x
[18] Nicole B. Ellison, Charles Steinfield, and Cliff Lampe.
2011. Connection Strategies: Social Capital
Implications of Facebook-enabled Communication
Practices. New Media & Society 13, 6 (Sept. 2011),
873–892. DOI:
http://dx.doi.org/10.1177/1461444810385389
[19] Facebook. 2018. Facebook Launches New Initiative to
Help Scholars Assess Social Media’s Impact on
Elections. (Apr 2018). https:
//about.fb.com/news/2018/04/new-elections-initiative/
[20] Jessica K. Flake, Jolynn Pek, and Eric Hehman. 2017.
Construct Validation in Social and Personality
Research: Current Practice and Recommendations.
Social Psychological and Personality Science 8, 4
(May 2017), 370–378. DOI:
http://dx.doi.org/10.1177/1948550617693063
[21] Floyd Jackson Fowler, Jr. 1992. How Unclear Terms
Affect Survey Data. Public Opinion Quarterly 56, 2
(1992), 218. DOI:http://dx.doi.org/10.1086/269312
[22] GALLUP. 2018. Computers and the Internet. (2018).
https:
//news.gallup.com/poll/1591/computers-internet.aspx
[23] Homero Gil de Zúñiga, Trevor Diehl, Brigitte Huber,
and James Liu. 2017. Personality Traits and Social
Media Use in 20 Countries: How Personality Relates to
Frequency of Social Media Use, Social Media News
Use, and Social Media Use for Social Interaction.
Cyberpsychology, Behavior, and Social Networking 20,
9 (Sept. 2017), 540–552. DOI:
http://dx.doi.org/10.1089/cyber.2017.0295
[24] Andrew Markus Guess. 2015. A New Era of
Measurable Effects? Essays on Political
Communication in the New Media Age. Ph.D.
Dissertation. Columbia University.
[25] Katherine Haenschen. 2019. Self-Reported Versus
Digitally Recorded: Measuring Political Activity on
Facebook. Social Science Computer Review (Jan.
2019), 089443931881358. DOI:
http://dx.doi.org/10.1177/0894439318813586
[26] J.T. Hancock, X. Liu, M. French, M. Luo, and H.
Mieczkowski. 2019. Social Media Use and
Psychological Well-being: A Meta-analysis. In 69th
Annual International Communication Association
Conference.
[27] F. Maxwell Harper and Joseph A. Konstan. 2015. The
MovieLens Datasets: History and Context. ACM Trans.
Interact. Intell. Syst. 5, 4, Article 19 (Dec. 2015), 19
pages. DOI:http://dx.doi.org/10.1145/2827872
[28] Lindsay H. Hoffman and Hui Fang. 2014. Quantifying
Political Behavior on Mobile Devices over Time: A
User Evaluation Study. Journal of Information
Technology & Politics 11, 4 (Oct. 2014), 435–445.
DOI:http://dx.doi.org/10.1080/19331681.2014.929996
[29] Melissa G Hunt, Rachel Marx, Courtney Lipson, and
Jordyn Young. 2018. No More FOMO: Limiting Social
Media Decreases Loneliness and Depression. Journal
of Social and Clinical Psychology 37, 10 (2018),
751–768.
[30] Ian Hussey and Sean Hughes. 2018. Hidden Invalidity
Among Fifteen Commonly Used Measures In Social
and Personality Psychology. (2018). DOI:
http://dx.doi.org/10.31234/osf.io/7rbfp
[31] Wade C. Jacobsen and Renata Forste. 2011. The Wired
Generation: Academic and Social Outcomes of
Electronic Media Use Among University Students.
Cyberpsychology, Behavior, and Social Networking 14,
5 (May 2011), 275–280. DOI:
http://dx.doi.org/10.1089/cyber.2010.0135
[32] Jennifer Jerit, Jason Barabas, William Pollock, Susan
Banducci, Daniel Stevens, and Martijn Schoonvelde.
2016. Manipulated vs. Measured: Using an
Experimental Benchmark to Investigate the
Performance of Self-Reported Media Exposure.
Communication Methods and Measures 10, 2-3 (April
2016), 99–114. DOI:
http://dx.doi.org/10.1080/19312458.2016.1150444
[33] Reynol Junco. 2012a. The Relationship Between
Frequency of Facebook Use, Participation in Facebook
Activities, and Student Engagement. Computers &
Education 58, 1 (Jan. 2012), 162–171. DOI:
http://dx.doi.org/10.1016/j.compedu.2011.08.004
[34] Reynol Junco. 2012b. Too Much Face and Not Enough
Books: The Relationship Between Multiple Indices of
Facebook Use and Academic Performance. Computers
in Human Behavior 28, 1 (Jan. 2012), 187–198. DOI:
http://dx.doi.org/10.1016/j.chb.2011.08.026
[35] Reynol Junco. 2013. Comparing Actual and
Self-Reported Measures of Facebook Use. Computers
in Human Behavior 29, 3 (May 2013), 626–631. DOI:
http://dx.doi.org/10.1016/j.chb.2012.11.007
[36] Reynol Junco and Shelia R. Cotten. 2012. No A 4 U:
The Relationship Between Multitasking and Academic
Performance. Computers & Education 59, 2 (Sept.
2012), 505–514. DOI:
http://dx.doi.org/10.1016/j.compedu.2011.12.023
[37] Pascal Jürgens, Birgit Stark, and Melanie Magin. 2019.
Two Half-Truths Make a Whole? On Bias in
Self-Reports and Tracking Data. Social Science
Computer Review (Feb. 2019), 089443931983164.
DOI:http://dx.doi.org/10.1177/0894439319831643
[38] Aryn C. Karpinski, Paul A. Kirschner, Ipek Ozer,
Jennifer A. Mellott, and Pius Ochwo. 2013. An
Exploration of Social Networking Site Use,
Multitasking, and Academic Performance Among
United States and European University Students.
Computers in Human Behavior 29, 3 (May 2013),
1182–1192. DOI:
http://dx.doi.org/10.1016/j.chb.2012.10.011
[39] Paul A. Kirschner and Aryn C. Karpinski. 2010.
Facebook® and Academic Performance. Computers in
Human Behavior 26, 6 (Nov. 2010), 1237–1245. DOI:
http://dx.doi.org/10.1016/j.chb.2010.03.024
[40] Robert Kraut and Moira Burke. 2015. Internet Use and
Psychological Well-being: Effects of Activity and
Audience. Commun. ACM 58, 12 (Nov. 2015), 94–100.
DOI:http://dx.doi.org/10.1145/2739043
[41] Ethan Kross, Philippe Verduyn, Emre Demiralp,
Jiyoung Park, David Seungjae Lee, Natalie Lin, Holly
Shablack, John Jonides, and Oscar Ybarra. 2013.
Facebook Use Predicts Declines in Subjective
Well-Being in Young Adults. PLoS ONE 8, 8 (Aug.
2013), e69841. DOI:
http://dx.doi.org/10.1371/journal.pone.0069841
[42] Ozan Kuru and Josh Pasek. 2016. Improving Social
Media Measurement in Surveys: Avoiding
Acquiescence Bias in Facebook Research. Computers
in Human Behavior 57 (April 2016), 82–92. DOI:
http://dx.doi.org/10.1016/j.chb.2015.12.008
[43] Michael J. LaCour and Lynn Vavreck. 2014. Improving
Media Measurement: Evidence From the Field.
Political Communication 31, 3 (July 2014), 408–420.
DOI:http://dx.doi.org/10.1080/10584609.2014.921258
[44] Chul-joo Lee, Robert Hornik, and Michael Hennessy.
2008. The Reliability and Stability of General Media
Exposure Measures. Communication Methods and
Measures 2, 1-2 (May 2008), 6–22. DOI:
http://dx.doi.org/10.1080/19312450802063024
[45] Sonia Livingstone. 2003. On the Challenges of
Cross-national Comparative Media Research. European
journal of communication 18, 4 (2003), 477–500.
[46] Maike Luhmann, Louise C. Hawkley, Michael Eid, and
John T. Cacioppo. 2012. Time Frames and the
Distinction Between Affective and Cognitive
Well-being. Journal of Research in Personality 46, 4
(Aug. 2012), 431–441. DOI:
http://dx.doi.org/10.1016/j.jrp.2012.04.004
[47] Teresa K. Naab, Veronika Karnowski, and Daniela
Schlütz. 2019. Reporting Mobile Social Media Use:
How Survey and Experience Sampling Measures
Differ. Communication Methods and Measures 13, 2
(April 2019), 126–147. DOI:
http://dx.doi.org/10.1080/19312458.2018.1555799
[48] Rebekah H. Nagler. 2017. Measurement of Media
Exposure. In The International Encyclopedia of
Communication Research Methods, Jörg Matthes,
Christine S. Davis, and Robert F. Potter (Eds.). John
Wiley & Sons, Inc., Hoboken, NJ, USA, 1–21. DOI:
http://dx.doi.org/10.1002/9781118901731.iecrm0144
[49] Anton J. Nederhof. 1985. Methods of Coping With
Social Desirability Bias: A Review. European Journal
of Social Psychology 15, 3 (July 1985), 263–280. DOI:
http://dx.doi.org/10.1002/ejsp.2420150303
[50] Nic Newman. 2019. Reuters Institute Digital News
Report 2019. (2019), 156.
[51] Nicole B. Ellison and danah m. boyd. 2013. Sociality
Through Social Network Sites. In The Oxford
Handbook of Internet Studies, William H. Dutton (Ed.).
[52] Jennifer J. Otten, Benjamin Littenberg, and Jean R.
Harvey-Berino. 2010. Relationship Between Self-report
and an Objective Measure of Television-viewing Time
in Adults. Obesity 18, 6 (June 2010), 1273–1275. DOI:
http://dx.doi.org/10.1038/oby.2009.371
[53] Philip M. Podsakoff, Scott B. MacKenzie, Jeong-Yeon
Lee, and Nathan P. Podsakoff. 2003. Common Method
Biases in Behavioral Research: A Critical Review of
the Literature and Recommended Remedies. Journal of
Applied Psychology 88, 5 (2003), 879–903. DOI:
http://dx.doi.org/10.1037/0021-9010.88.5.879
[54] William Pollock, Jason Barabas, Jennifer Jerit, Martijn
Schoonvelde, Susan Banducci, and Daniel Stevens.
2015. Studying Media Events in the European Social
Surveys Across Research Designs, Countries, Time,
Issues, and Outcomes. European Political Science 14, 4
(Dec. 2015), 394–421. DOI:
http://dx.doi.org/10.1057/eps.2015.67
[55] Jacob Poushter, Caldwell Bishop, and Hanyu Chwe.
2018. Social Media Use Continues to Rise in
Developing Countries But Plateaus Across Developed
Ones. Pew Research Center 22 (2018).
[56] Markus Prior. 2009a. The Immensely Inflated News
Audience: Assessing Bias in Self-Reported News
Exposure. Public Opinion Quarterly 73, 1 (2009),
130–143. DOI:http://dx.doi.org/10.1093/poq/nfp002
[57] Markus Prior. 2009b. Improving Media Effects
Research through Better Measurement of News
Exposure. The Journal of Politics 71, 3 (July 2009),
893–908. DOI:
http://dx.doi.org/10.1017/S0022381609090781
[58] Kelly Quinn and Zizi Papacharissi. 2018. The
Contextual Accomplishment of Privacy. International
Journal of Communication 12 (2018), 23.
[59] Melanie Revilla, Carlos Ochoa, and Germán Loewe.
2017. Using Passive Data From a Meter to Complement
Survey Data in Order to Study Online Behavior. Social
Science Computer Review 35, 4 (Aug. 2017), 521–536.
DOI:http://dx.doi.org/10.1177/0894439316638457
[60] N. C. Schaeffer and J. Dykema. 2011. Questions for
Surveys: Current Trends and Future Directions. Public
Opinion Quarterly 75, 5 (Dec. 2011), 909–961. DOI:
http://dx.doi.org/10.1093/poq/nfr048
[61] Michael Scharkow. 2016. The Accuracy of
Self-Reported Internet Use—A Validation Study Using
Client Log Data. Communication Methods and
Measures 10, 1 (Jan. 2016), 13–27. DOI:
http://dx.doi.org/10.1080/19312458.2015.1118446
[62] Michael Scharkow and Marko Bachl. 2017. How
Measurement Error in Content Analysis and
Self-Reported Media Use Leads to Minimal Media
Effect Findings in Linkage Analyses: A Simulation
Study. Political Communication 34, 3 (July 2017),
323–343. DOI:
http://dx.doi.org/10.1080/10584609.2016.1235640
[63] Frank M. Schneider, Sabine Reich, and Leonard
Reinecke. 2017. Methodological Challenges of POPC
for Communication Research. In Permanently Online,
Permanently Connected (1 ed.), Peter Vorderer,
Dorothée Hefner, Leonard Reinecke, and Christoph
Klimmt (Eds.). Routledge, New York and London :
Routledge, Taylor & Francis Group, 2017., 29–39.
DOI:http://dx.doi.org/10.4324/9781315276472-4
[64] Norbert Schwarz and Daphna Oyserman. 2001. Asking
Questions About Behavior: Cognition,
Communication, and Questionnaire Construction. The
American Journal of Evaluation 22, 2 (2001), 127–160.
[65] Aaron Smith, Laura Silver, Courtney Johnson, and
Jiang Jingjing. 2019. Publics in Emerging Economies
Worry Social Media Sow Division, Even as They Offer
New Chances for Political Engagement. (2019).
[66] Jessica Staddon, Alessandro Acquisti, and Kristen
LeFevre. 2013. Self-Reported Social Network
Behavior: Accuracy Predictors and Implications for the
Privacy Paradox. In 2013 International Conference on
Social Computing. IEEE, Alexandria, VA, USA,
295–302. DOI:
http://dx.doi.org/10.1109/SocialCom.2013.48
[67] Stein Rokkan, Sidney Verba, Jean Viet, and Elina
Almasy. 1969. Comparative survey analysis.
[68] Sebastian Stier, Johannes Breuer, Pascal Siegers, and
Kjerstin Thorson. 2019. Integrating Survey Data and
Digital Trace Data: Key Issues in Developing an
Emerging Field. Social Science Computer Review
(April 2019), 089443931984366. DOI:
http://dx.doi.org/10.1177/0894439319843669
[69] Fritz Strack. 1992. “Order Effects” in Survey Research:
Activation and Information Functions of Preceding
Questions. In Context Effects in Social and
Psychological Research, Norbert Schwarz and
Seymour Sudman (Eds.). Springer New York, New
York, NY, 23–34. DOI:
http://dx.doi.org/10.1007/978-1-4612-2848-6_3
[70] David Tewksbury, Scott L. Althaus, and Matthew V.
Hibbing. 2011. Estimating Self-Reported News
Exposure Across and Within Typical Days: Should
Surveys Use More Refined Measures? Communication
Methods and Measures 5, 4 (Oct. 2011), 311–328.
DOI:http://dx.doi.org/10.1080/19312458.2011.624650
[71] Philippe Verduyn, David Seungjae Lee, Jiyoung Park,
Holly Shablack, Ariana Orvell, Joseph Bayer, Oscar
Ybarra, John Jonides, and Ethan Kross. 2015. Passive
Facebook usage undermines affective well-being:
Experimental and longitudinal evidence. Journal of
Experimental Psychology: General 144, 2 (2015),
480–488. DOI:http://dx.doi.org/10.1037/xge0000057
[72] Emily Vraga, Leticia Bode, and Sonya Troller-Renfree.
2016. Beyond Self-Reports: Using Eye Tracking to
Measure Topic and Style Differences in Attention to
Social Media Content. Communication Methods and
Measures 10, 2-3 (April 2016), 149–164. DOI:
http://dx.doi.org/10.1080/19312458.2016.1150443
[73] Emily K. Vraga and Melissa Tully. 2018. Who Is
Exposed to News? It Depends on How You Measure:
Examining Self-Reported Versus Behavioral News
Exposure Measures. Social Science Computer Review
(Nov. 2018), 089443931881205. DOI:
http://dx.doi.org/10.1177/0894439318812050
[74] Marta Walentynowicz, Stefan Schneider, and Arthur A.
Stone. 2018. The Effects of Time Frames on
Self-Report. PLOS ONE 13, 8 (Aug. 2018), e0201655.
DOI:http://dx.doi.org/10.1371/journal.pone.0201655
[75] Yiran Wang and Gloria Mark. 2018. The Context of
College Students’ Facebook Use and Academic
Performance: An Empirical Study. In Proceedings of
the 2018 CHI Conference on Human Factors in
Computing Systems. ACM, 418.
[76] Richard B. Warnecke, Timothy P. Johnson, Noel
Chávez, Seymour Sudman, Diane P. O’Rourke, Loretta
Lacey, and John Horm. 1997. Improving Question
Wording in Surveys of Culturally Diverse Populations.
Annals of Epidemiology 7, 5 (July 1997), 334–342.
DOI:http://dx.doi.org/10.1016/S1047-2797(97)00030-6
[77] James G Webster and Jacob Wakshlag. 1985.
Measuring Exposure to Television. Selective exposure
to communication (1985), 35–62.
[78] Anke Wonneberger and Mariana Irazoqui. 2017.
Explaining Response Errors of Self-Reported
Frequency and Duration of TV Exposure Through
Individual and Contextual Factors. Journalism & Mass
Communication Quarterly 94, 1 (March 2017),
259–281. DOI:
http://dx.doi.org/10.1177/1077699016629372
[79] Michael Zimmer. 2010. “But the Data is Already
Public”: On the Ethics of Research in Facebook. Ethics
and Information Technology 12, 4 (Dec. 2010),
313–325. DOI:
http://dx.doi.org/10.1007/s10676-010-9227-5
[80] Zizi Papacharissi and A. Mendelson. 2011. Toward a
New(er) Sociability: Uses, Gratifications and Social
Capital on Facebook. In A networked self: identity,
community and culture on social network sites, Zizi
Papacharissi (Ed.). Routledge.
